Gender Gap Visualization
A visualization about Gender Gap in the Film Industry over the past 100 Years. Data collected from IMDB. Co-authored with Chenglin Zhang and Ruitian Wu.
Visualization Project for DKU-STATS 402 (Instr: Prof. Xin Tong)
Submitted and accepted as a poster presentation for ChinaVis 2022.
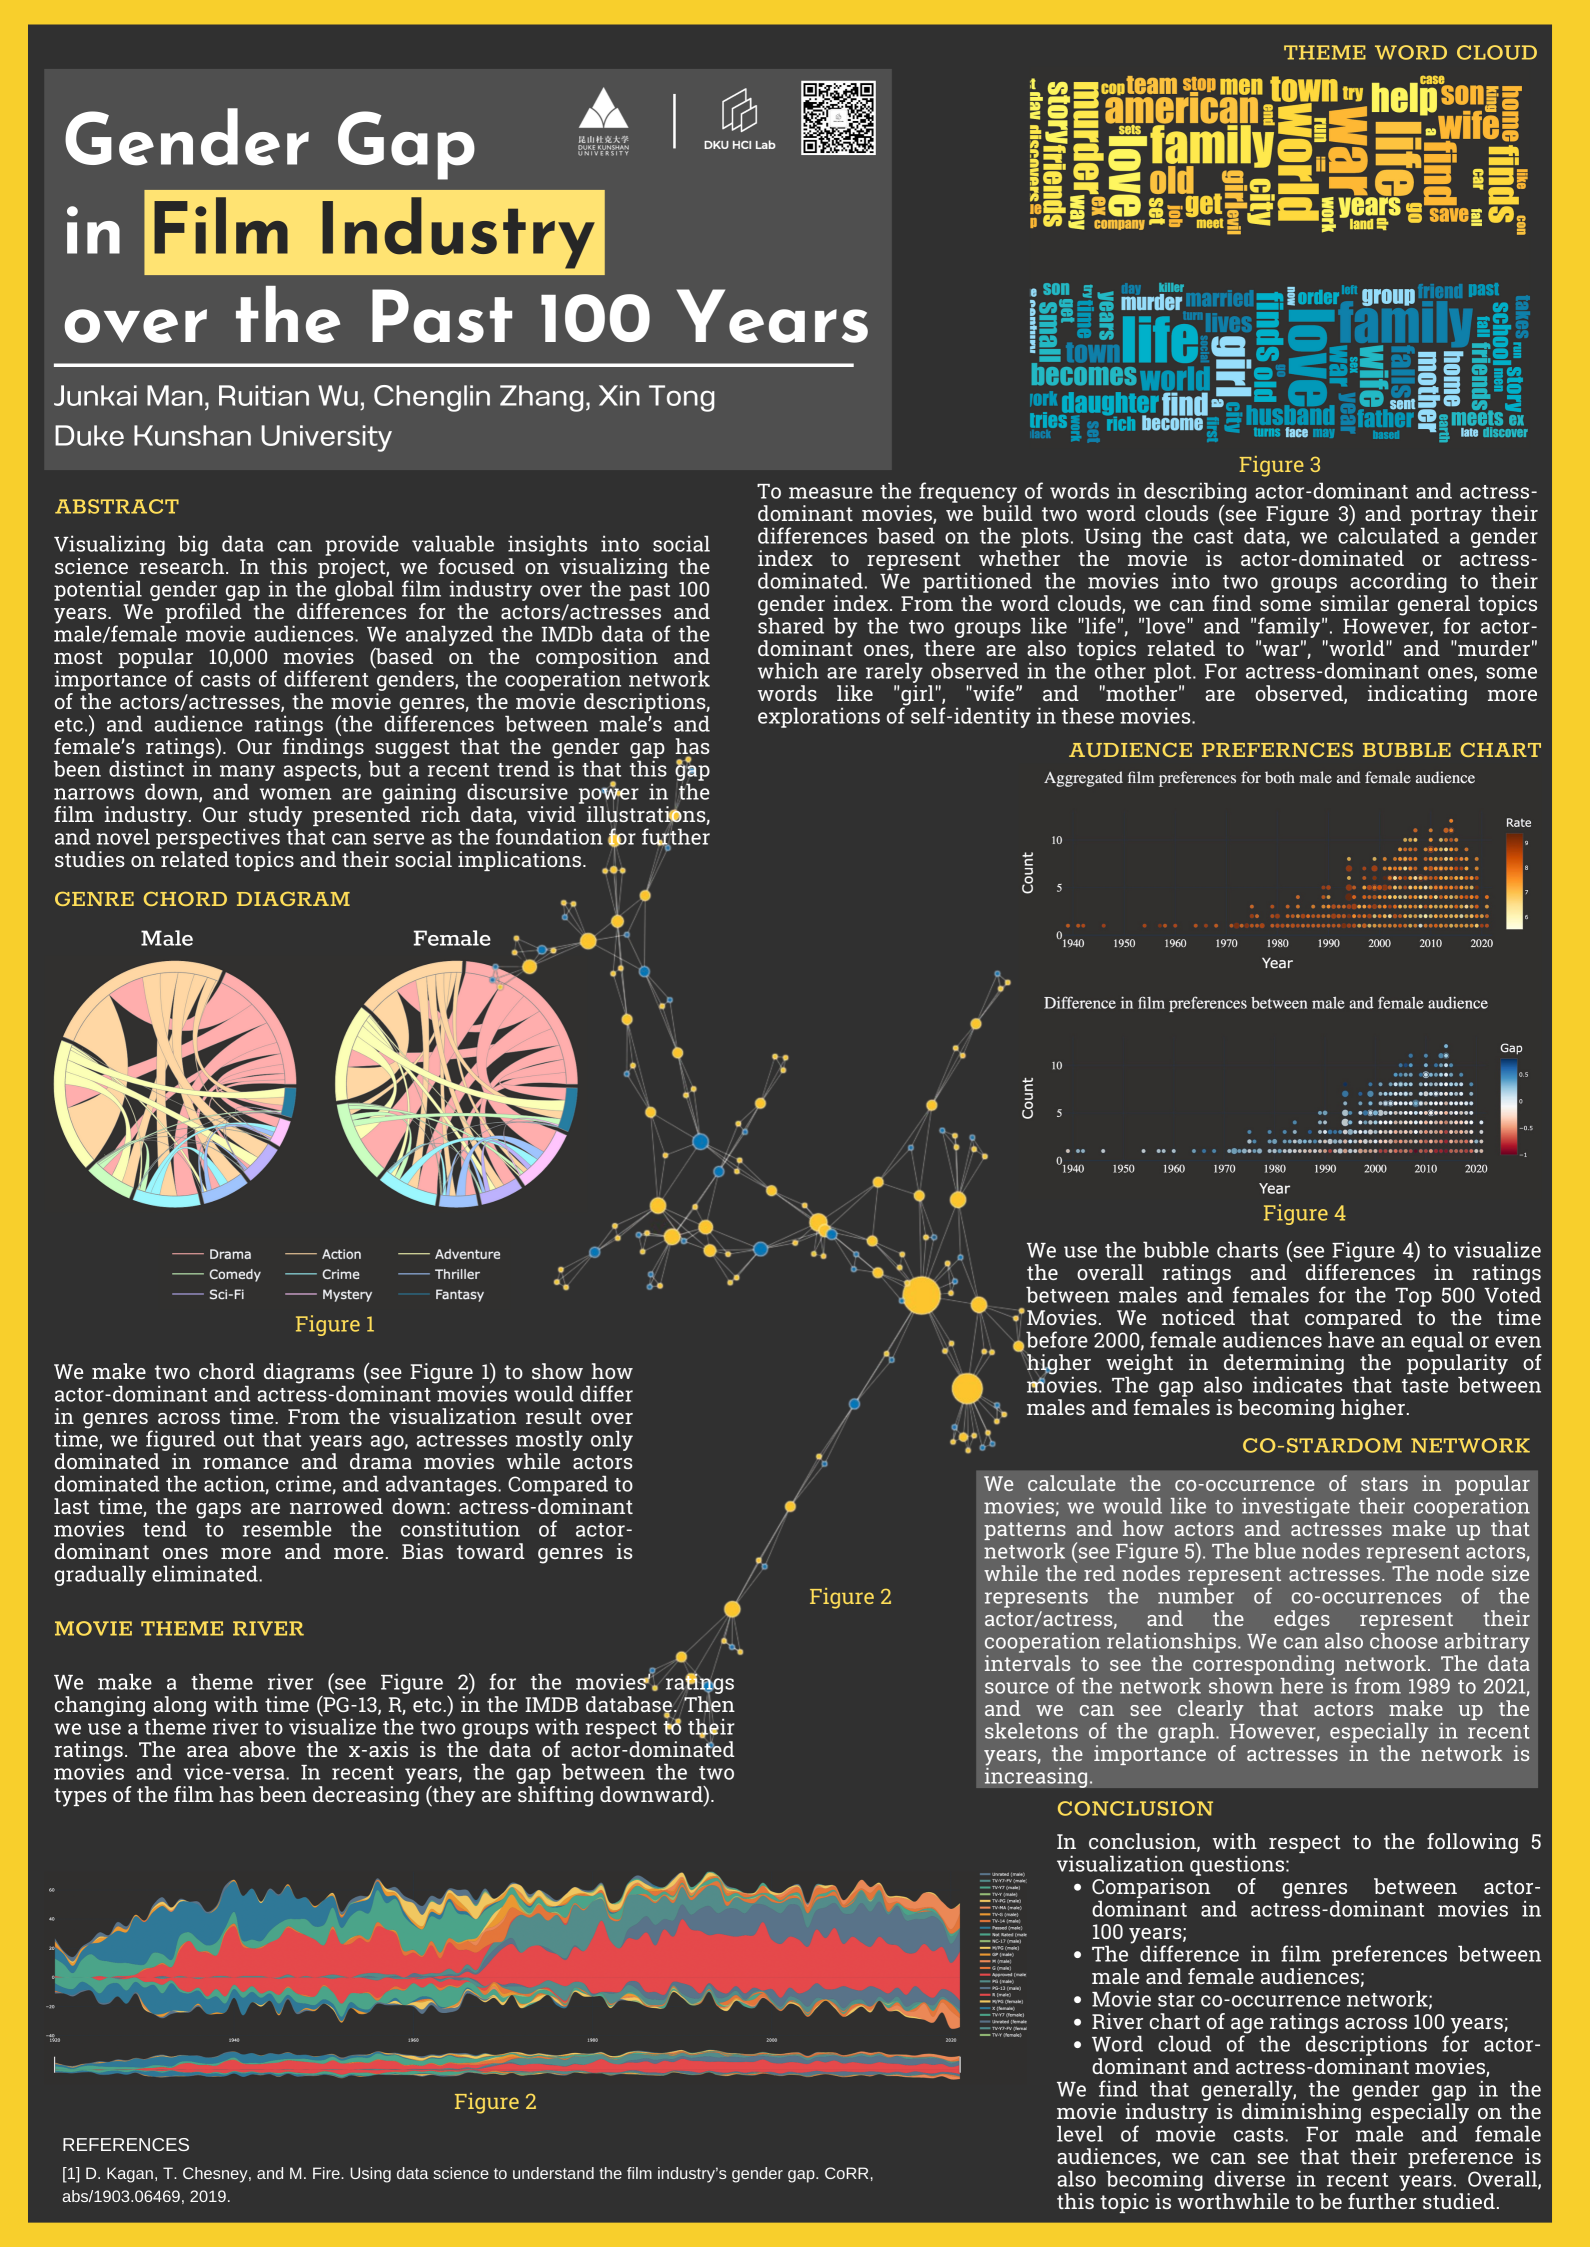
Motivation
We want to investigate the variation of the gap from 1920 to 2021: Does the gap exist? How distinct is the gap? How does the gap change as time goes on? With the questions in hand and numerous time-series data, it is critical to use visualizations to answer the above questions intuitively with engaging interactions. By looking into the visualizations, we can gain valuable insights into the general trend of the gender gap over the 100 years, and thus will have a starting point for further investigation and statistical examination.
Method
We used Python Scrapy and HTTP Request methods to crawl IMDb records. We crawled 10200 records (movies) from 1920 to 2021 in total. Each year, we crawled the 100 most voted (highest number of votes) movies. For each record, the crawled data include the movie title, year, genre, runtime, certificate, IMDb rating (total and for male and female raters), movie description, director name, star name, their corresponding IMDb ID, number of votes, and gross (if available). We calculated an index to indicate whether the movie is actor-dominant or actress-dominant by checking the cast list and the sequence of the stars listed in it. We split all the records into two groups (actor-dominant and actress-dominant) by the index. The two groups are about 3:2 in size (actor: actress).
For task 1, IMDb generally will include 3 genres for each movie, so there are co-occurrences among different genres. It is the same with the cast list in task 2, as stars also have co-occurrences. Thus, by calculating the adjacency matrix, we can create the co-stardom network and the chord diagram for genres. For the theme river in task 3, records for actor- and actress-dominated movies are placed above/below the x-axis respectively.
 caption: A chord diagram visualizing how actor-dominant and actress-dominant movies differ in genres across time. One finding is that before the 1970th most actresses starred in drama and romance films while actors dominate the movies of action, crime, and adventures. However, the gap has been narrowing down in recent years as the composition of two chord diagrams are approaching the same.
 caption: This is a network visualizing the co-occurrence of stars in popular movies. It shows the cooperation relationship in the film industry, and we can get an intuitive sense of how actors and actresses make up the industry. The yellow and blue nodes represent actors and actresses, respectively. The size of the node represents the number of occurrences of the star, and the edges represent their cooperation relationships. Users can select a specified time interval to reconstruct the network.
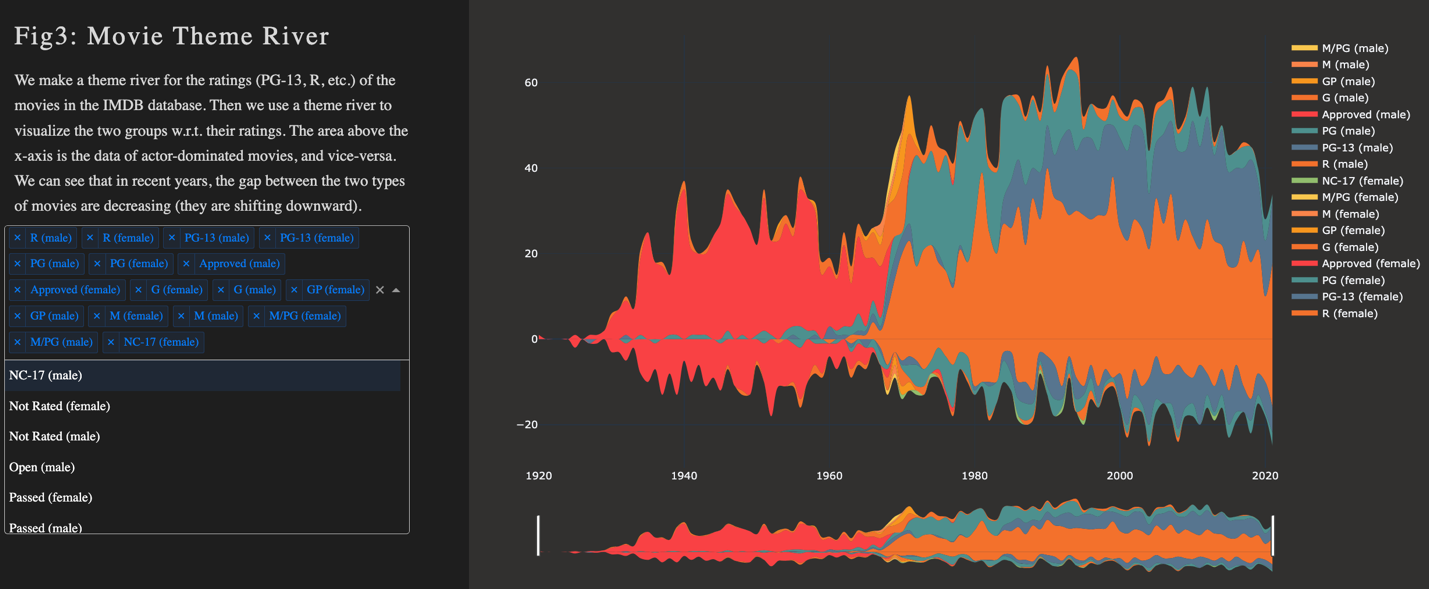 caption: This is a Theme River visualization showing the distribution of ratings (PG-13, R, etc.) in the past 100 years for both male and female-dominant movies. The area above the x-axis is the data of actor-dominated movies, and vice-versa. We can see that in recent years, the distribution of ratings is becoming more homogeneous, indicating that the gap between the two types of movies is decreasing (they are shifting downward).
 caption: This is a Word Cloud visualization showing the frequency of words in descriptions of actor and actress dominant movies. We build two word clouds representing two genders and portray their differences. From the word clouds, we can find some general similar topics shared by the two groups. However, for actor-dominant ones, there are also topics related to "war", "world" and "murder”. For actress-dominant ones, some words like "girl", "wife" and "mother" are observed, indicating more explorations of self-identity in these movies.
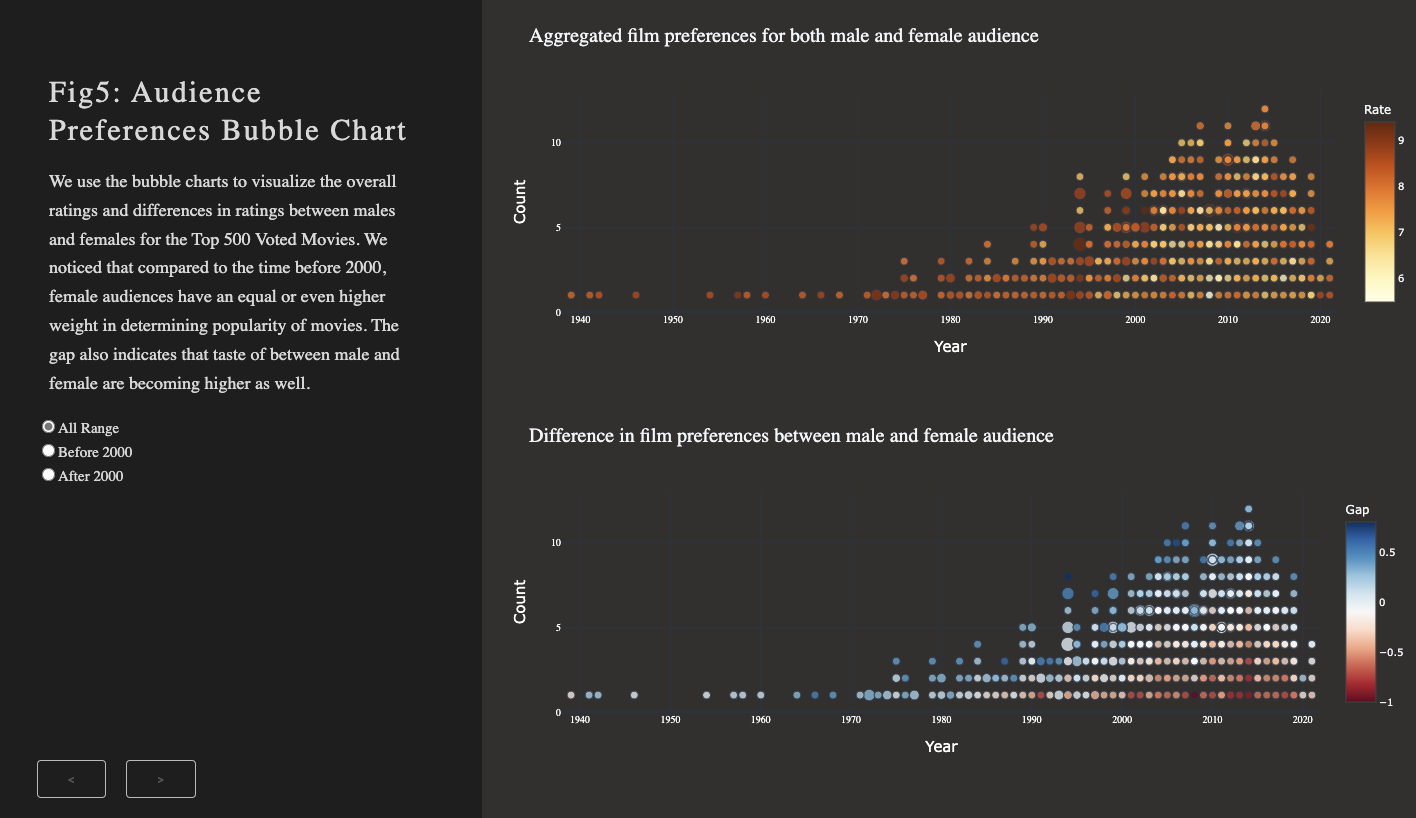 caption: This is a bubble chart visualizing the overall ratings and gaps in ratings between males and females for the Top 500 Voted Movies. We noticed that compared to the time before 2000, female audiences have an equal or even higher weight in determining the popularity of movies. The gap also indicates that the gap of the taste between male and female audiences is becoming larger than before.
Published: 2022-02-14